In this series of tests, we will determine the torque values at which the different LBJ bolts reach their yield, ultimate, and fracture loads.
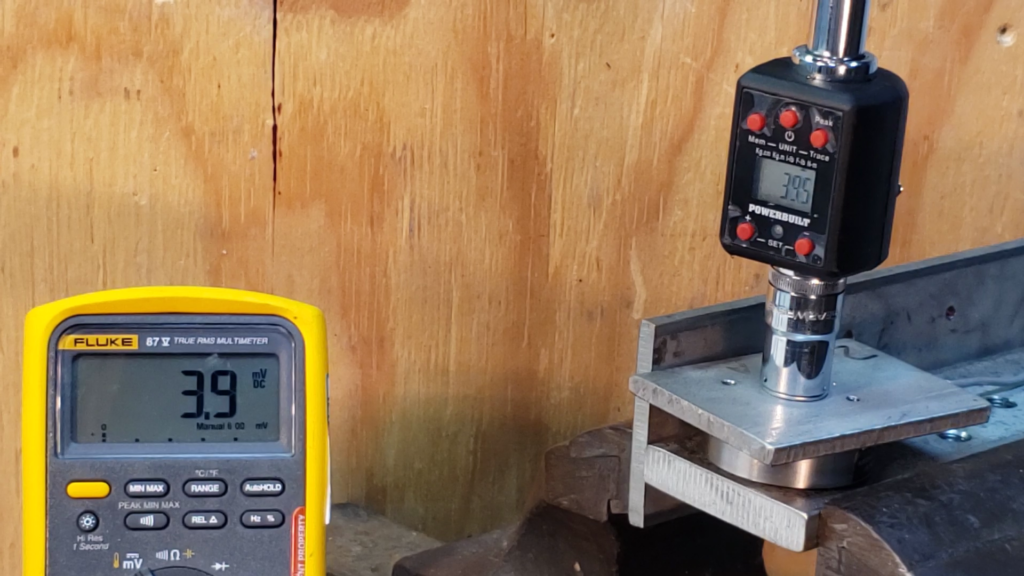
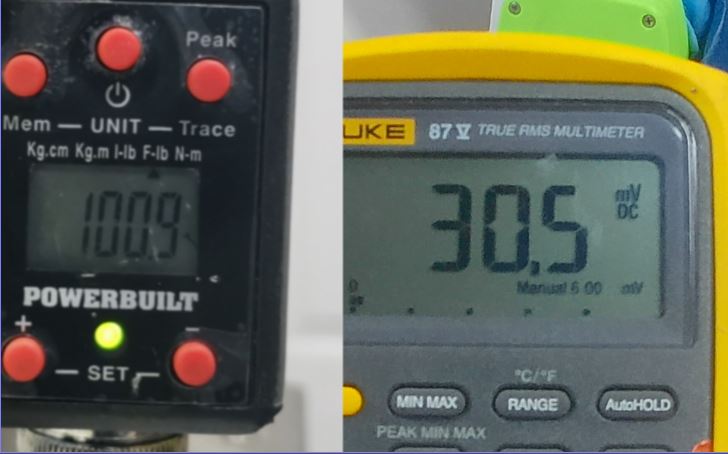
We used the same test setup as for the load vs. torque testing – a tapped stainless steel plate to represent the steering knuckle, a flat stainless steel plate to represent the balljoint flange, and a load cell sandwiched between the two plates to measure the load. A torque transducer was used to measure the applied torque, and a digital multimeter (DMM) was used to read the load cell output. As a bolt was tightened, the display of both the DVM and the torque transducer were recorded and superimposed in the same frame, to provide a direct load vs. torque correlation.
Test Setup
Torque Transducer and DMM readouts
The video clip below shows how the process works for the last few seconds in the life of an ARP bolt.
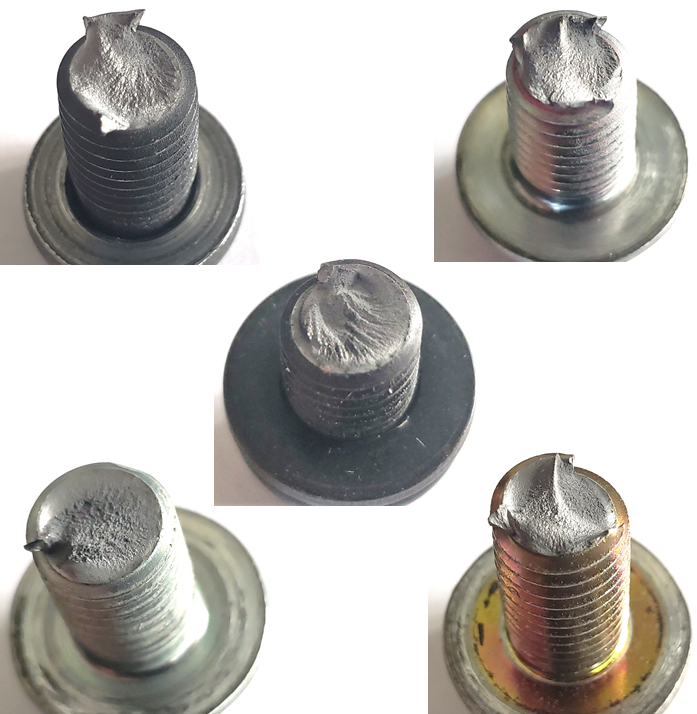
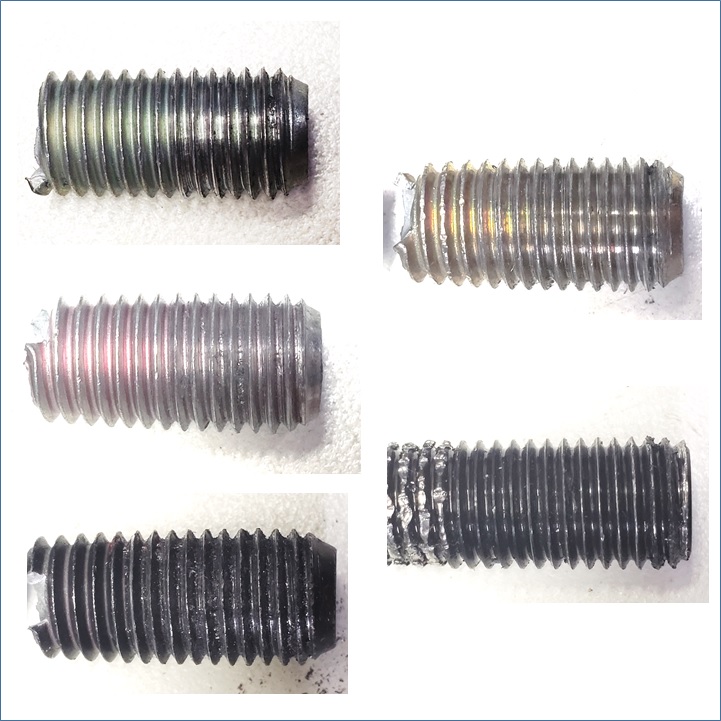
Below are some photos of the broken bolts, showing the fracture surface and the diameter reduction (necking} just before failure.
Fracture Surfaces
Diameter Reduction (Necking)
Test Results
With this background out of the way, let’s get to the test results!
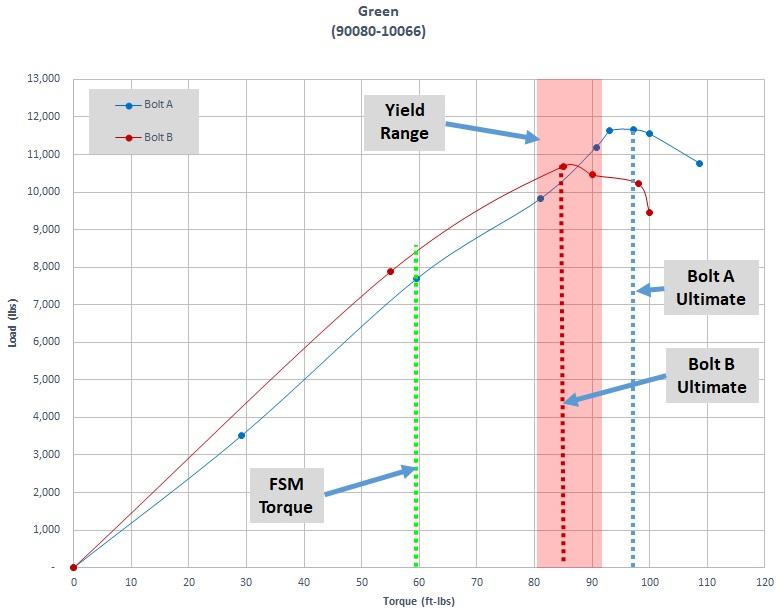
Toyota Green (90080-10066)
The load vs. torque traces for the two Green bolts torqued to failure show that Bolt A reached its ultimate load at 97 ft-lbs (11,666 lbs), and fractured at 108 ft-lbs (10,769 lbs), while Bolt B reached ultimate load at 85 ft-lbs (10,691 lbs), and fractured at 100 ft-lbs (9,442 lbs).
A couple of other elements were added to the plot to illustrate how much margin exists above the Factory Service Manual (FSM) torque value. First, a dotted green line was drawn at 59 ft-lbs to indicate the FSM value of 59 ft-lbs. Then, an attempt was made to identify the torque range at which the bolts yielded (this is considered to be the failure load, rather than ultimate load). Because the yield load is not as easy to pinpoint as the ultimate load, a pink box was drawn to bound the range of estimated yield load torques. These boxes should be viewed only as an approximation.
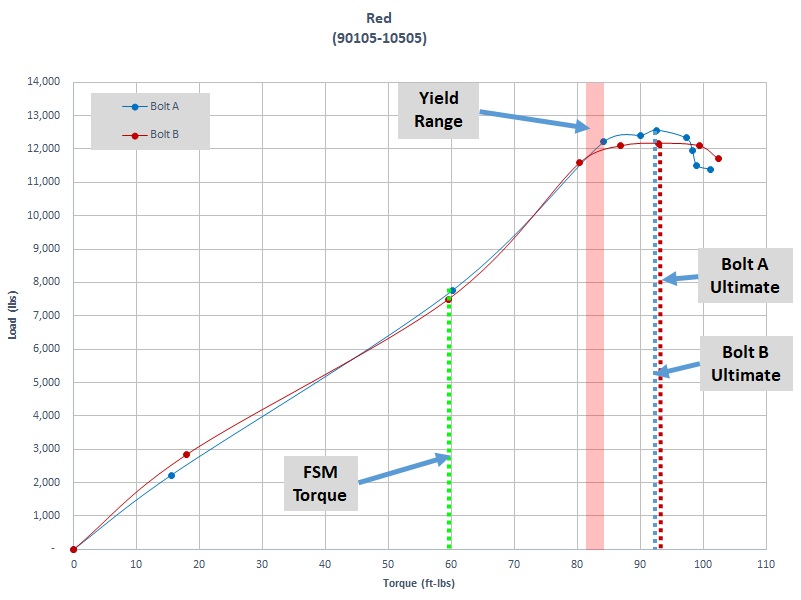
Toyota Red (90105-10505)
Similar data was plotted for the two Red bolts. Bolt A reached its ultimate load at 92.6 ft-lbs (12,564 lbs), and Bolt B at 93 ft-lbs (12,173 lbs). As for the Green bolt, the FSM torque value of 59 ft-lbs was represented by the green line, and the range of Yield Load torques was approximated by the pink box.
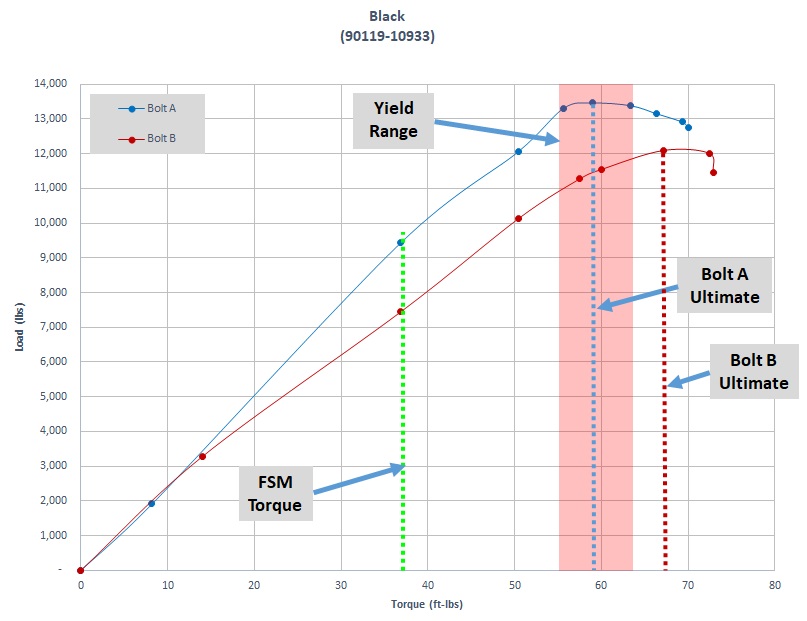
Toyota Black (90119-10933)
Black Bolt A reached its ultimate load at 59 ft-lbs (13,461 lbs), and Bolt B at 67.1 ft-lbs (12,095 lbs). The FSM specifies a torque of 37 ft-lbs (vs. 59 ft-lbs for all other bolts).
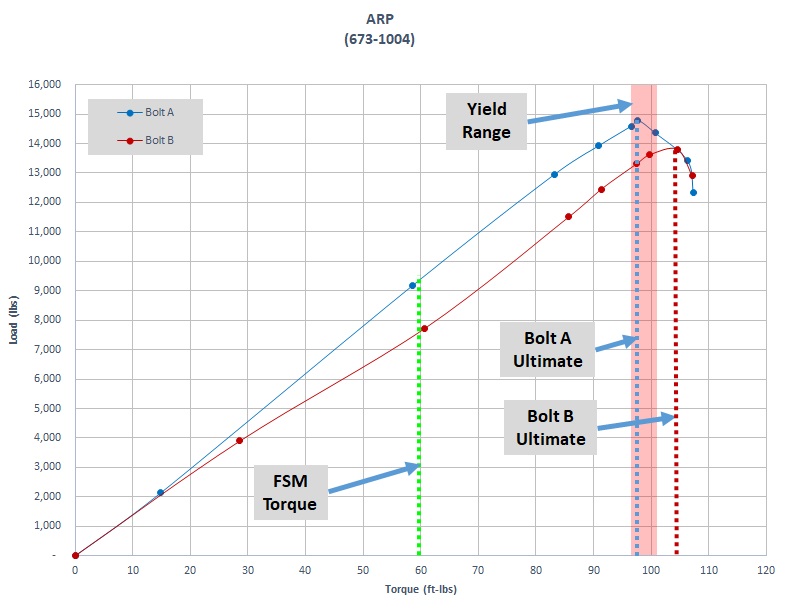
ARP (673-1004)
We initially started the test program using ARP 663-1003 bolts, which are 30 mm long hex head bolts. They performed well in preload vs. torque tests; however, during the torque-to-failure tests, it became clear that they did not have sufficient engagement, and started stripping. We therefore switched to the longer 35 mm 12 point bolts, ARP 673-1004 . Using these bolts, Bolt A reached its ultimate load at 97.7 ft-lbs (14,788 lbs), and Bolt B at 104.5 ft-lbs (13,812 lbs).
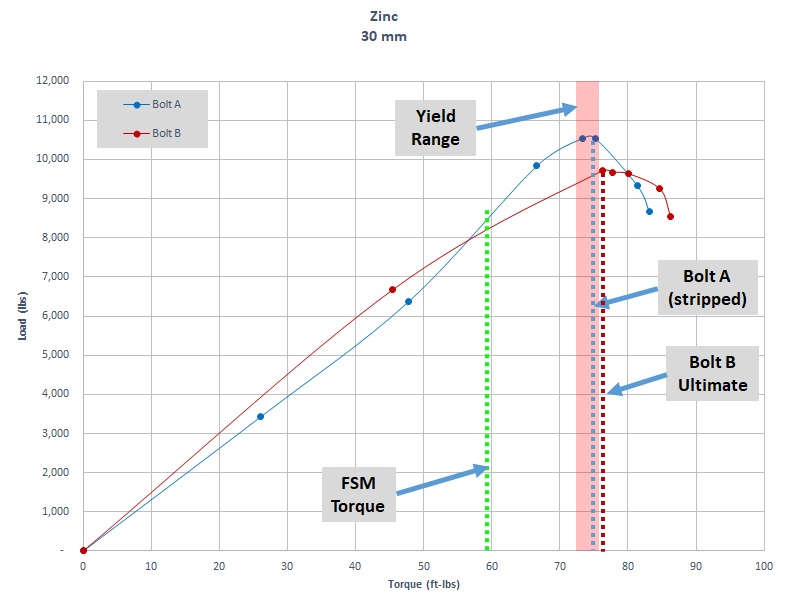
Belmetric 10.9 Yellow Zinc (BF10X1.25X30YLW)
The testing started with the same 30mm bolts that were used for the load vs. torque testing. However, the torque to failure tests of these bolts were unsuccessful – some bolts stripped at the threads before reaching the Yield Load.
Only one bolt (Bolt B) could be torqued to failure – it reached an ultimate load of 9,715 lbs at 76 ft-lbs, and broke at 86 ft lbs.
These bolts likely stripped because at 30mm long, they are about 2mm shorter than the Toyota OEM bolts (32mm long), leading to almost two less threads of engagement. This would not be an issue in an actual LBJ installation, but because we had a load cell sandwiched in the load path, there was not enough thread engagement to handle the higher applied loads.
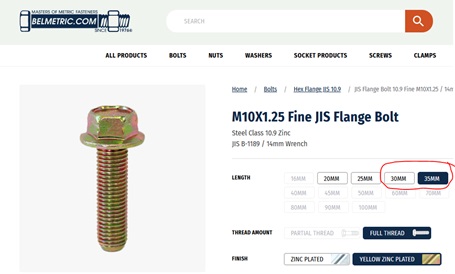
So we procured some longer 35 mm Zinc bolts (BF10X1.25X35YLW) to continue the testing.
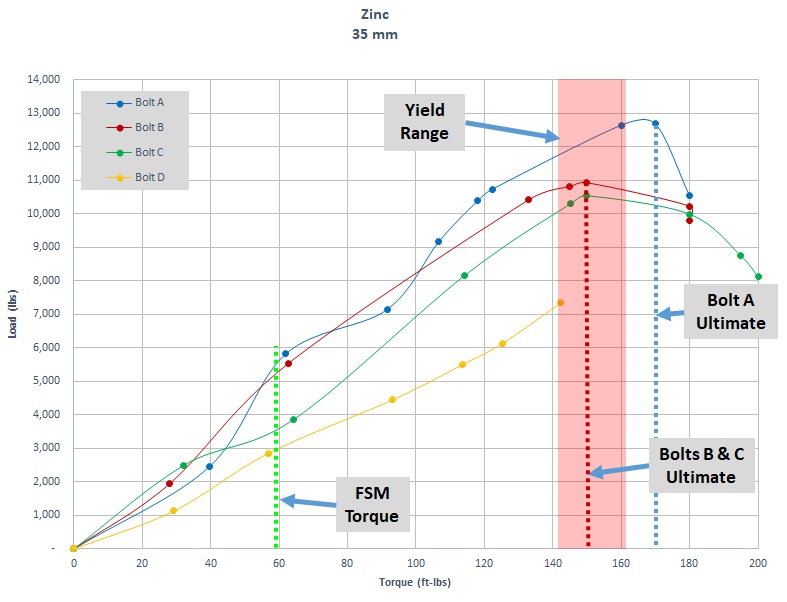
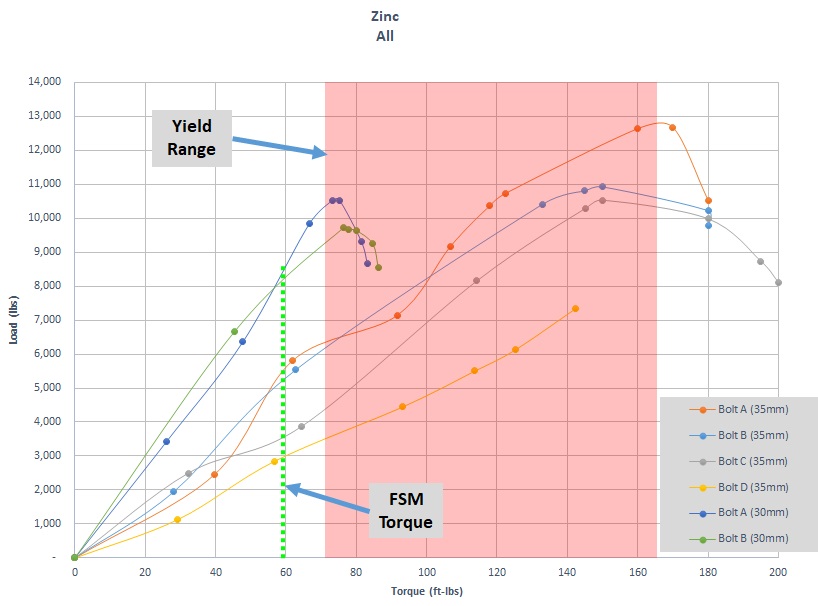
Belmetric 10.9 Yellow Zinc (BF10X1.25X35YLW)
The Zinc 35mm Bolt A reached its ultimate load at 170 ft-lbs (12,681 lbs), Bolt B at 150 ft-lbs (10,925 lbs), and Bolt C at 150 ft-lbs (10,535 lbs). The torque transducer that was used for these tests has a maximum limit of 150 ft-lbs, so above those values, we had to rely on clicking of the torque wrench. Therefore, results above 150 ft-lbs may be less accurate.
Because a significant difference in performance was noted between the 30mm and 35mm bolts, the two sets of results were combined into one plot for a closer examination.
It is evident from this plot that the preload generated at the FSM value of 59 ft-lbs was much lower for the 35mm bolts (4,500 lbs) than for the 30mm bolts (8,500 lbs). That’s only about half the preload at the same torque value!
To put this into practical terms, if we torqued a 30mm bolt to 59 ft-lbs, we could expect around 8,500 of load; but if we installed a 35mm bolt and tightened it to the same torque, we could end up with only half the load (4,500 lbs) – and we would not know this, because there would be no load cell in the setup. Also, it is notable that for some bolts, the installation torque of 59 ft-lbs is dangerously close to the yield torque of 70 ft-lbs.
There was significantly more scatter from bolt to bolt within the same batch of 35mm bolts – some bolts reached almost 6,000 lbs at 59 ft-lbs, others only 2,500 lbs. The scatter in 30mm bolts was smaller.
Finally, the 30mm bolts reached their Utimate Load at around 75 ft-lbs of torque; the 35mm needed over twice the torque (150 to 170 ft-lbs) to reach the same Ultimate load.
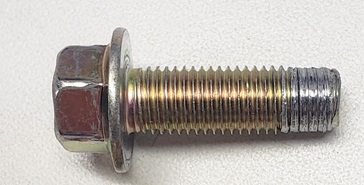
This tells us that the friction properties of the coating were vastly different between the 30mm and 35mm bolts. This is surprising and disconcerting, because the 35mm bolts came from the same supplier, and from the same family as the original 30 mm bolts, just 5 mm longer:
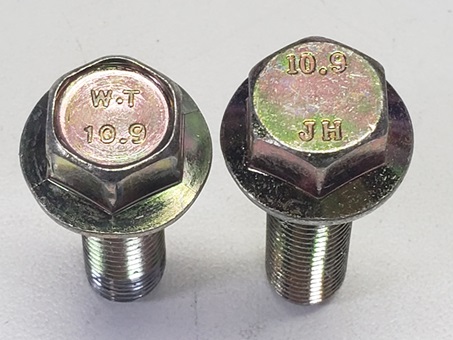
The 35mm bolts we received appeared to have different head markings than the 30mm bolts, despite being from the same family. While both heads are stamped with 10.9, the different head shape (flat vs. inset) and the different letters indicate that they likely came from different factories and different manufacturers.
Regardless of the reason, the performance of the 30mm and 35mm bolts was different enough to raise concerns. The testing clearly shows that when ordering these generic Class 10.9 zinc bolts, one would have no idea how much preload can be expected when installed to the FSM torque values – it could be as high as 10,000 lbs, or as low as 2,500 lbs. This uncertainty, and the risk of very low preload, would be highly problematic in critical installations such as LBJ.
Summary
The torque to failure data is very useful in determining how close to failure the different bolts tested are when installed per the FSM requirements.
There is one clear loser in this testing, and that is the Zinc bolt. The variability from batch to batch and bolt to bolt leaves us with no idea of how much load is being introduced during torquing, and how close that load is to failure. In retrospect, this perhaps should have been expected. All the other bolts are branded (either Toyota or ARP), with specific part numbers. One would expect that for those bolts, the manufacturer has taken care to control the surface finishes and friction coefficents to serve repeatably in the expected application. In contrast, the Zinc bolts are not branded – they are supplied by a reputable supplier, but there is no control on the coatings and friction, other than to specify “Yellow Zinc” and a strength. Our test results show the danger of using these bolts without testing each batch.
Based on these tests, our recommendation would be to stay away from any unbranded bolt for the LBJ application, no matter what strength class they are.
When it comes to picking the winner, these torque to failure results are not sufficient on their own to declare one. All of the bolts (other than Zinc) reached good preload levels at FSM torque values, and had reasonable margin to failure torque. Their yield strengths were also comparable (though ARP was clearly stronger).
There are many possible criteria for being a “winner” – highest strength, highest preload at FSM value, lowest scatter, highest margin between FSM torque and failure torque, lowest preload loss with reuse, etc. So rather than declaring a single winner, we will look at all the data collected to date, and will try to draw some conclusions about these bolts in our final article.